Short Answer
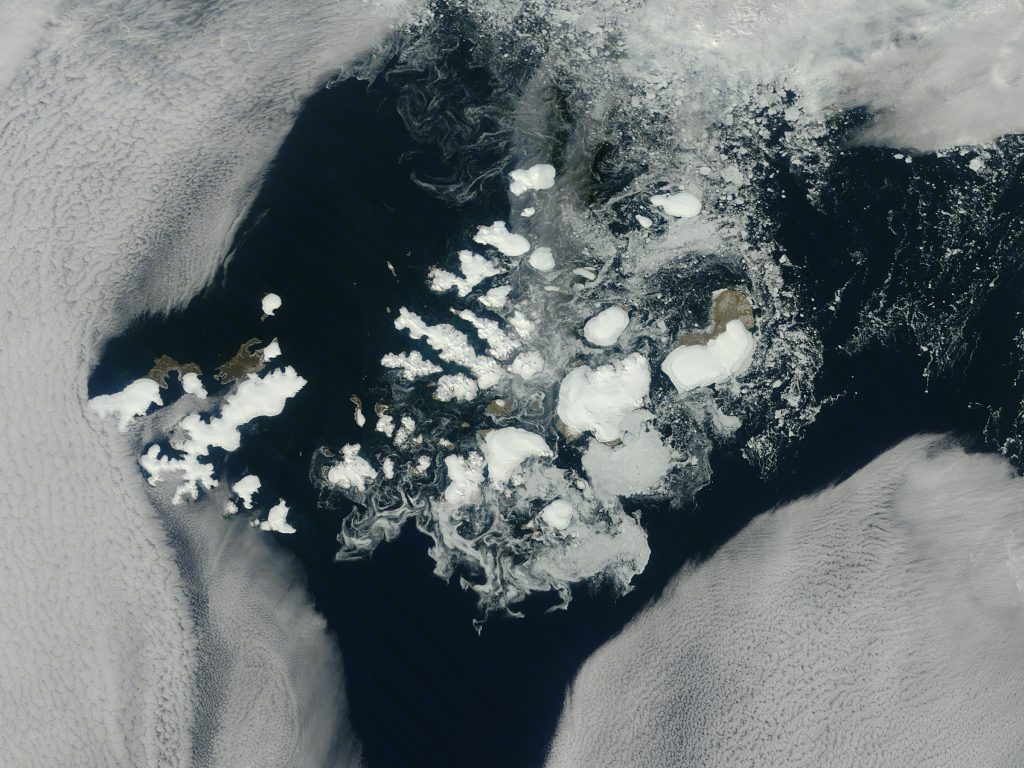
Sea ice in the Barents Sea forms a dynamic barrier around Franz Josef Land, influencing regional climate, marine ecosystems, and the feasibility of Arctic navigation. The archipelago lies between 80° N and 81° N, extending from roughly 30 km west of the North Pole, where sea‑ice conditions are among the most extreme in the Northern Hemisphere.
Over the past three decades, scientific monitoring has shifted from anecdotal ship logs to satellite‑derived metrics, allowing precise quantification of ice coverage, edge position, and the duration of the ice season. These parameters are now integral to climate‑change assessments and to the operational planning of research vessels and icebreakers that service the Russian Arctic National Park.
Recent peer‑reviewed work by Matishov and Zhichkin (2017) compared ice regimes for the 2010/11 and 2014/15 seasons, linking observed variability to large‑scale climate oscillations such as the Arctic Oscillation (AO) and the North Atlantic Oscillation (NAO). Their findings illustrate a subtle but measurable retreat of the ice edge and a shortening of the ice season, trends that echo broader patterns across the Barents Sea.
This article synthesises historical evidence, modern observations, and emerging research to present a comprehensive picture of sea‑ice dynamics around Franz Josef Land, highlighting both established trends and persisting uncertainties.
Study Area
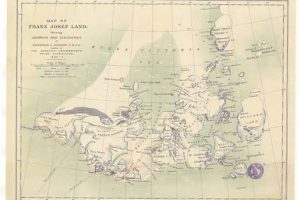
The study area comprises the maritime zone that directly borders the islands of Franz Josef Land, extending roughly 150 km outward to the open Barents Sea. The archipelago consists of about 190 islands, the largest being Zemlya Georga (≈2 300 km²) and Rudolf Island (≈350 km²). Administratively the islands belong to Arkhangelsk Oblast and are protected within the Russian Arctic National Park, established in 2009.
Key observational sites include the Ernst Krenkel Observatory on Hayes Island (Ostrov Khayesa) and the former Tikhaya Bay station on Hooker Island, both of which host automated weather stations (AWS) and ice‑monitoring equipment. Satellite coverage is provided by the NOAA/NSIDC Advanced Microwave Scanning Radiometer (AMSR‑E) and the European Copernicus Sentinel‑1 SAR missions.
What Scientists Measure
Researchers quantify sea ice using a suite of parameters:
- Ice coverage area: total surface area occupied by sea ice, expressed in million square kilometres.
- Ice‑edge position: distance (in kilometres) from a fixed coastal reference point to the outermost continuous ice margin.
- Ice‑season duration: number of days between the first freeze‑up and final melt‑out each year.
- Ice thickness: measured by upward‑looking sonar on research vessels and by satellite altimetry (CryoSat‑2).
- Snow on ice: gauged by AWS snow gauges and by passive microwave algorithms.
In‑situ observations are complemented by remote‑sensing techniques. Microwave radiometers detect the emissivity contrast between ice and open water, while synthetic‑aperture radar (SAR) provides high‑resolution maps of ice type (first‑year versus multi‑year ice). Data are ingested into the NSIDC Sea Ice Index, which supplies daily and monthly climatologies.
Historical Evidence
Early 20th‑century expeditions supplied the first systematic ice records. Fridtjof Nansen’s Fram expedition (1893‑1896) noted the persistence of fast ice along the western coast of the archipelago, while the 1912–13 Russian Arctic Expedition under Boris Vilkitsky documented the timing of seasonal break‑up in the vicinity of Hall Island.
These narrative accounts were later digitised and incorporated into the Russian State Oceanographic Institute’s ice‑season database, providing a baseline that stretches back to 1900. However, the qualitative nature of these records limits their comparability with modern satellite data.
Recent Research
Since the early 2000s, coordinated programs have intensified monitoring:
| Institution | Period | Main Focus | Data Products |
|---|---|---|---|
| Russian Arctic and Antarctic Research Institute (AARI) | 2005‑present | Long‑term sea‑ice climatology, ice‑edge mapping | Monthly ice‑coverage maps, edge‑position time series |
| National Snow and Ice Data Center (NSIDC) | 1972‑present | Global sea‑ice indices, satellite validation | Sea Ice Index, daily concentration grids |
| University of Tromsø – Arctic Research Center | 2010‑2022 | Ice‑thickness retrieval using CryoSat‑2 | Thickness climatology, multi‑year ice maps |
| Institute of Oceanology, Russian Academy of Sciences | 2014‑2021 | Ocean‑ice interaction, Atlantic Water inflow | Temperature‑salinity profiles, ice‑drift trajectories |
These efforts have produced high‑resolution datasets that enable interannual comparisons. The 2017 study by Matishov and Zhichkin leveraged the electronic Barents Sea ice database to compare the 2010/11 and 2014/15 seasons, revealing a modest but consistent retreat of the ice edge and a reduction in the ice‑season length (Matishov & Zhichkin 2017).
What Has Changed
Analysis of satellite records from 1979 to 2022 shows a clear downward trend in average seasonal ice coverage around Franz Josef Land. The mean spring (March) ice extent has declined by roughly 12 % relative to the 1980s baseline, while the mean autumn (September) extent has fallen by about 9 % (NSIDC 2023). The ice‑edge has migrated outward by an average of 20‑30 km during the same period, exposing more open water to wind‑driven wave action.
Correspondingly, the ice‑season duration has shortened by 5–7 days per decade, with the latest melt‑out dates occurring in early August rather than late July (Matishov & Zhichkin 2017). Ice thickness measurements indicate a loss of multi‑year ice, with first‑year ice now constituting over 70 % of the total pack during winter, down from roughly 55 % in the 1990s.
These changes are closely tied to the positive phase of the Arctic Oscillation, which promotes warmer Atlantic inflow into the Barents Sea, and to the long‑term warming trend of the Arctic surface air temperature, which has risen by about 2 °C since the 1980s (Polyakov et al. 2004).
Uncertainty and Open Questions
Despite robust satellite coverage, several uncertainties remain:
- Cloud‑contamination bias in passive microwave retrievals can under‑estimate thin ice during melt periods.
- Spatial resolution limits hinder detection of narrow leads and polynyas that influence local wildlife.
- Model‑data assimilation struggles to capture the complex feedbacks between Atlantic Water inflow, sea‑ice formation, and wind‑driven transport.
- Long‑term continuity of in‑situ observations is threatened by the logistical challenges of maintaining stations on remote islands.
Future research priorities include deploying additional autonomous ice‑profiling buoys, improving SAR‑based ice classification algorithms, and integrating high‑resolution ocean models to resolve the interplay between water mass properties and ice dynamics.
Data Sources
Key repositories for sea‑ice information around Franz Josef Land are:
- NSIDC Sea Ice Index (daily concentration, 1979‑present).
- Russian State Oceanographic Institute ice‑season database (1900‑present).
- Copernicus Marine Environment Monitoring Service (CMEMS) for sea‑surface temperature and salinity profiles.
- ESA Sentinel‑1 SAR archive for high‑resolution ice‑edge mapping.
- CryoSat‑2 Level‑2 ice‑thickness products (2005‑present).
These datasets are openly accessible for scientific analysis and support ongoing monitoring programmes coordinated by AARI, the Russian Academy of Sciences, and international partners.
FAQ
How is sea ice around Franz Josef Land measured today?
Modern measurements combine satellite microwave radiometry, SAR imaging, and in‑situ instruments such as upward‑looking sonar on research vessels and automated weather stations on the islands.
Has the ice season become shorter in recent decades?
Yes. Studies show a reduction of 5–7 days per decade in the duration of the ice season, with melt‑out now occurring in early August rather than late July.
Why does sea‑ice change affect wildlife in the archipelago?
Many species, including polar bears and ivory gulls, rely on stable ice for hunting, breeding and migration; reduced ice extent shortens foraging windows and forces animals onto smaller ice platforms.



Leave a Reply